Time series
%matplotlib inline
Just checking the logic.
import matplotlib.pyplot as plt
from dcprogs.likelihood import plot_time_series
from dcprogs.likelihood.random import time_series as random_time_series

perfect, series = random_time_series(N=100, n=100, tau=1)
print(perfect)
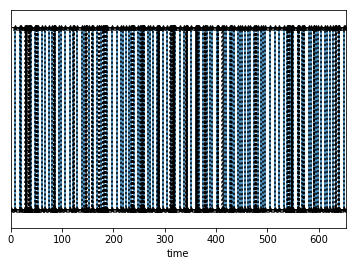
fig, ax = plt.subplots(1,1)
plot_time_series(perfect, ax=ax)
plot_time_series(series, ax=ax, marker='*', color='k', linestyle=':')
[   0.            8.94723321   17.58625122   20.91738707   30.20777201
   39.32092447   46.79161468   52.77685434   61.48455584   67.44456259
   74.100705     81.16816666   86.41390341   93.2990448    98.32441428
  105.58728546  114.71226183  121.79759018  128.39316551  137.89193074
  143.38102535  152.56225579  160.16272388  167.17517573  175.01513147
  180.92863655  188.3360409   197.29145568  206.70028088  213.93436107
  218.10289559  224.6773545   230.09537989  233.76001015  240.67886355
  247.87099605  251.756665    255.63396464  260.34412052  267.56884572
  271.05676428  276.28833648  285.1861875   288.87919303  296.47228537
  304.46016273  312.91504567  320.69227562  328.90975232  337.32091015
  342.86258197  351.00318569  359.85877781  362.9354895   366.49640284
  374.80184694  382.90380628  388.63786471  392.28760556  401.04635203
  404.57265817  414.50588183  419.35422088  426.84891827  430.39730468
  435.1928332   442.92866593  446.46914111  450.29317602  455.83836839
  461.27886045  465.35700447  474.47964825  482.3700017   487.15319401
  491.89688188  495.74211533  504.51676039  513.93686707  522.20488861
  531.23128829  537.67515504  543.47407658  550.50406751  558.884036
  568.0541782   571.76171722  581.04217683  584.39539916  591.43409644
  594.51307274  597.64494175  603.90633403  612.42260853  615.74390755
  621.16093995  627.8050522   634.23335659  639.03347348  648.10262786
  651.84007882]

from dcprogs.likelihood import time_filter as cpp_time_filter
filtered = cpp_time_filter(series, 1)
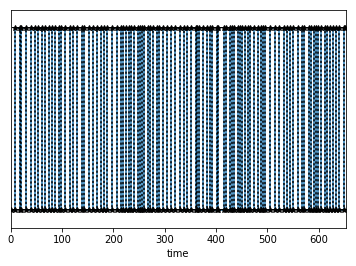
fig, ax = plt.subplots(1,1)
plot_time_series(perfect, ax=ax)
plot_time_series(filtered, ax=ax, marker='*', color='k', linestyle=':')

Now, computes the likelihood of this time series for a random QMatrix